|
1. An overview of the technical aspects: what can this technology do? (3 marks)
Following is my reflection on the topic of images, specifically Infogragphics In exploring this week's material I found that that I took a great interest in infographics. I was surprised to find that infographics are all around us and have been used for a long time (Rajamanickam, 2005). I also found that reading about infographics and different aspects of their use (such as how their use links to the Melbourne Declaration and how they relate to the Australian Curriculum, has brought them into a whole new light for me. The learning purpose of an infographic is to "display information" (Resource Link, 2011) in a manner that is more easily understood, and in a way that is possibly impossible with the use of text only (PC Magazine, cited in Resource Link, 2011). This is illustrated in Figure 1, which shows the difference between ‘Traditional’ learning and ‘Alternative’ learning incorporating infographics. 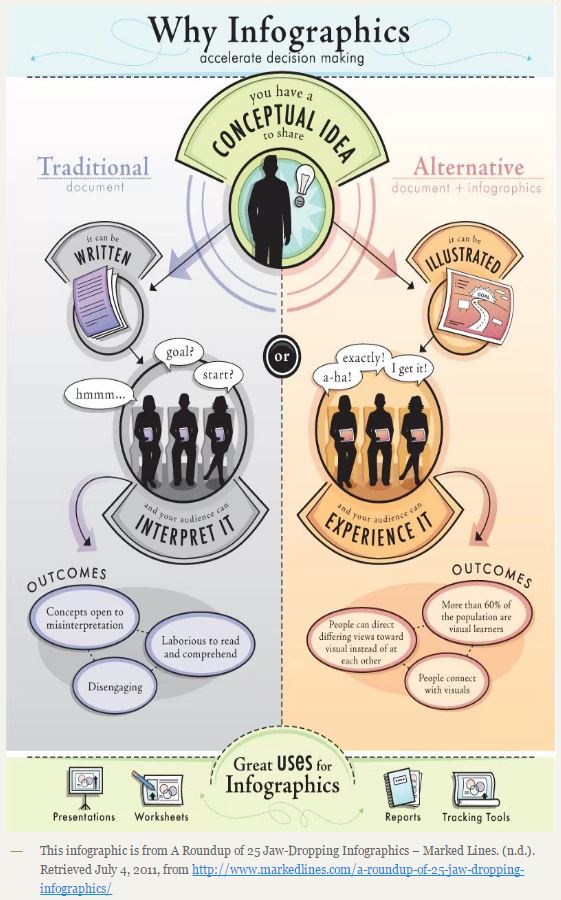 Figure 1 To answer the specific questions I have created an infographic using the web-based tool Easel.ly of my career path so far (Figure 2). This demonstrates my technical skill using the tool as I explain the tool and the steps I took to produce it. 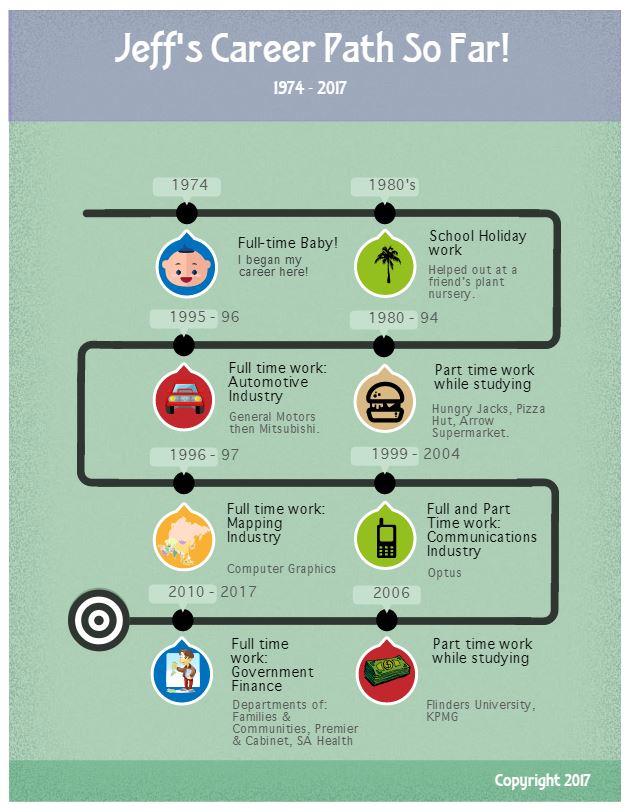 Figure 2 The settings in Easel.ly allow for the user to either make their own designed infographic or select from the templates available. I chose to use a template and explore the use of the editing tools. I found the tools easy to use, with the capacity to not only search for images, but import my own. There are also the expected tools such as inserting text and changing the background (see Figure 3).  Figure 3 At any given time, incomplete or complete, there is the option to download the infographic in different resolutions (Figure 4).  Figure 4 In terms of multi-author capability for collaboration, there are options such as ‘invite a friend to edit’ (Figure 5).  Figure 5 There is also the very important feature of being able to resize (Figure 6). Having printed a number of different size posters for my local Church, this feature is very handy!  Figure 6 Overall, I found the tool very easy to use, an account can be set up with a password to ensure security (Figure 7), the level of expertise required is basic for selecting and modifying a template, moving to advanced for designing your own infographic, depending of course on the level of complexity desired. On a personal level, this exercise has shown me the immense potential that infographics have in presenting information, normally it takes me quite a bit of time to go through the different roles I have undertaken – but with this, it cuts the time down significantly! 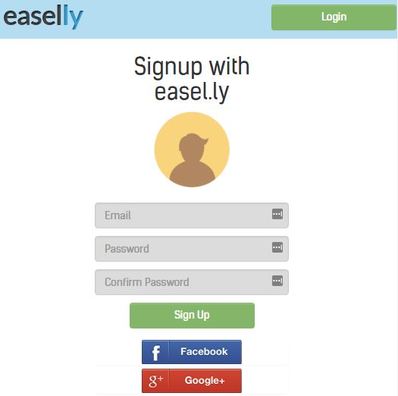 Figure 7 2. A discussion of the legal, safety and ethical protocols that should be considered when working with this technology (1 mark) With any form of creation there is always the issue of copyright . The creator needs to be mindful of work that they are taking from another, and in regards to use of this tool in the classroom, students should be made aware of copyright issues prior to computer use. Two excellent resources are:
Easel.ly’s 'Terms and Conditions of Use' cover the legal and ethical areas foreseen by the company, such as unlawful, obscene or copyrighted content (Figure 8), as well as pertinent information for teachers who wish for students under 13 years of age to use the site (Figure 9). 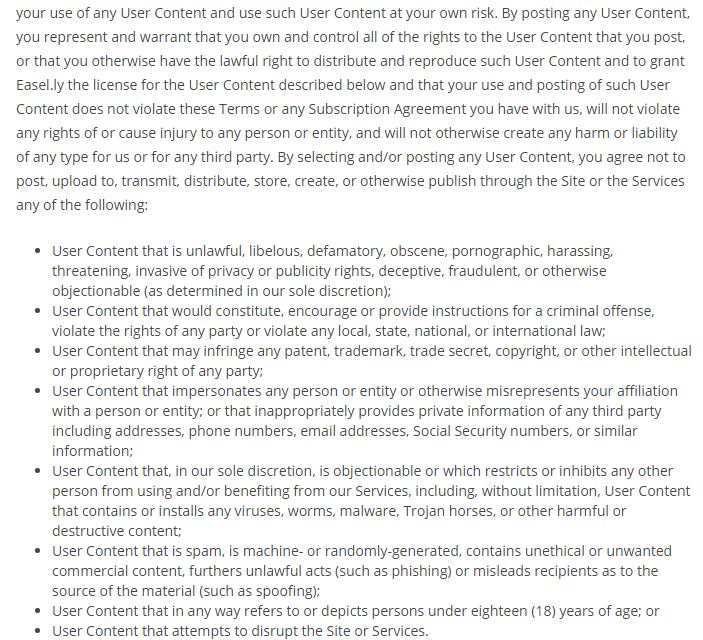 Figure 8 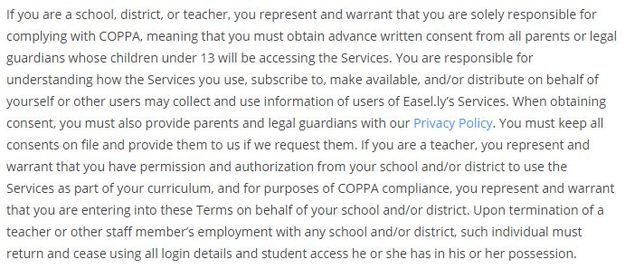 Figure 9 3. Suggestions about how this tool might be used in your teaching context. (2 marks). The article 'Info-what? Developing visual literacy through infographics' by Catholic Education (2011) states that there are three ways in which infographics can be used in the classroom:
Having looked at infographics at a deeper level than before, I now see them as much more than a poster, with far reaching benefits to teaching in the classroom. I can see myself using infographics in both of my teaching areas of IT and Business. Infographics will give students the opportunity to learn and experience many things such as the opportunity to "demonstrate their understanding collectively to groups of spectators" (Hall & Russac, 2015) and allow a freedom of expression and the opportunity for students to use their creativity that is not possible when presenting work in a text only format. Looking at lesson plans for years 7-10 on the website 'ReadWriteThink', there are a number of suggested lessons in which infographics are supportive of learning, these include learning to use 'How-to' writing (Wickline, 2017) and argumentative writing (Wickline, 2017). In my selection of suitable pedagogy I will take into account that much more than what is required in the actual lesson can be taught through the use of images and visuals. This includes learning different skills such as those I learnt using BeFunky (see blog post 'Pre-reflection 4.1') in image manipulation, as well as different programs such as Piktochart, which is recommended by the website 'ReadWriteThink' for students to use when making infographics. I would also consider using Infographics in assessment tasks in which students can "showcase their mastery of knowledge" (Schrock, 2017). Below is an infographic by Daniel Zeevi (n.d.) (Figure 10) that I could use to teach students about infographics themselves. 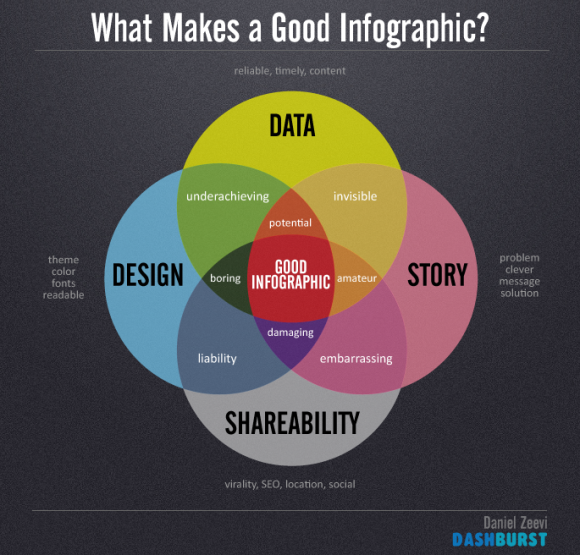 Figure 10 Using the SAMR model and the questions in Figure 11, this is how I would apply using infographics to teaching students about blogging in IT.
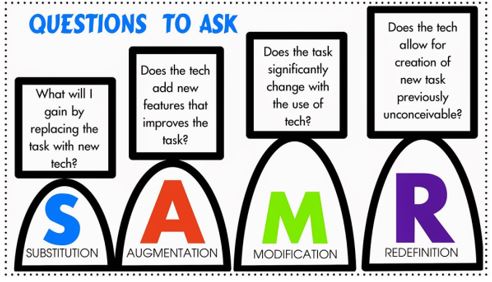 Figure 11 Reference List
Hall & Russac, (2015). Words, Pictures, Numbers, WOW! – 2nd Grade Infographics Attract Attention. Retrieved from http://theasideblog.blogspot.com.au/2015/01/words-pictures-numbers-wow-2nd-grade.html Readwritethink, (2017). Home Page. Retrieved from http://www.readwritethink.org/ Schrock, K. (2017). Infographics as a Creative Assessment. Retrieved from http://www.schrockguide.net/infographics-as-an-assessment.html Wickline, K (2017). A Picture IS Worth a Thousand Words: Using Infographics to Illustrate How-to Writing. Retrieved from http://www.readwritethink.org/classroom-resources/lesson-plans/picture-worth-thousand-words-a-31141.html. Wickline, K (2017). Picture This: Combining Infographics and Argumentative Writing. Retrieved from http://www.readwritethink.org/classroom-resources/lesson-plans/picture-this-combining-infographics-31135.html. Zeevi, D. (n.d.). What Makes a Good Infographic? Retrieved from https://tweakyourslides.files.wordpress.com/2013/07/good-infographic.png
0 Comments
Leave a Reply. |
 RSS Feed
